αKG-mediated carnitine synthesis drives DNA repair via histone acetylation
Thank you for visiting nature.com. You are using a browser version with limited support for CSS. To obtain the best experience, we recommend you use a more up to date browser (or turn off compatibility mode in Internet Explorer). In the meantime, to ensure continued support, we are displaying the site without styles and JavaScript.
Homologous recombination (HR) deficiency increases sensitivity to DNA-damaging agents that are commonly used to treat cancer1. In HR-proficient cancers, the metabolic mechanisms that drive response or resistance to DNA-damaging agents remain unclear. Here we have identified that depletion of α-ketoglutarate (αKG) sensitizes HR-proficient cells to DNA-damaging agents by metabolic regulation of histone acetylation. αKG is required for the activity of αKG-dependent dioxygenases2 (αKGDDs), and previous work has focused almost exclusively on the demethylase functions of αKGDD. Using a targeted CRISPR knockout library consisting of 64 αKGDDs, we discovered that trimethyllysine hydroxylase epsilon (TMLHE), the first and rate-limiting enzyme in de novo carnitine synthesis, is necessary for the survival of HR-proficient cells in the presence of DNA-damaging agents. Unexpectedly, αKG-mediated TMLHE-dependent carnitine synthesis was required for histone acetylation and was non-redundant with other nucleo-cytosolic acetyl-CoA-generating pathways. The increase in histone acetylation by means of the αKG–carnitine axis promoted HR-mediated DNA repair through site-specific histone acetylation. Finally, we observed a positive correlation between TMLHE and histone acetylation in patient samples and found that high TMLHE or acetylcarnitine correlates with worse progression-free survival in patients treated with DNA-damaging agents. This study demonstrates for the first time, to our knowledge, that αKG affects site-specific histone acetylation and provides a mechanism of HR proficiency through carnitine synthesis. Moreover, these data provide a metabolic avenue for inducing HR deficiency and promoting sensitivity to DNA-damaging agents.
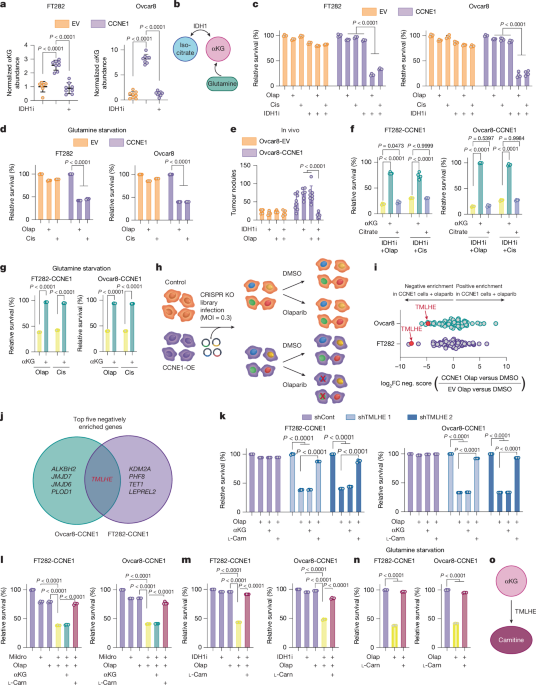
αKG is required as a co-substrate for αKGDDs in mammalian cells, and αKGDDs are inhibited by succinate2. Succinate supplementation was a phenocopy of decreased αKG in its ability to sensitize CCNE1-driven cells to DNA-damaging agents and was rescued by competing αKG supplementation (Extended Data Fig. 2a), indicating that this effect is due to decreased activity of αKGDDs. To ascertain which αKGDD is driving the observed phenotype, we constructed a CRISPR knockout library of 64 αKGDDs and performed a dropout screen in the presence of olaparib (Fig. 1h). TMLHE, which encodes the first and rate-limiting enzyme in de novo carnitine synthesis, was the only one of the top five genes to drop out in both CCNE1-driven cell lines (Fig. 1i,j, Supplementary Fig. 2a and Supplementary Table 2). Using TMLHE short hairpin RNA (shRNA) (Extended Data Fig. 2b,c) and the carnitine synthesis inhibitor mildronate, we validated this observation in both CCNE1-driven cell lines using both olaparib and cisplatin (Fig. 1k,l and Extended Data Fig. 2d,e), whereas empty-vector control cells were not sensitized to DNA-damaging agents by TMLHE knockdown or mildronate (Extended Data Fig. 2d,e and controls in Supplementary Fig. 2b–d). Supplementing TMLHE-knockdown cells or mildronate-treated cells with l-carnitine, but not αKG, reversed sensitivity to DNA-damaging agents, confirming that αKG was upstream of TMLHE-catalysed carnitine synthesis (Fig. 1k,l and Extended Data Fig. 2d,e). Similarly, supplementation of l-carnitine in combination with αKG-depleting conditions or succinate reversed sensitivity to olaparib or cisplatin (Fig. 1m,n, Extended Data Figs. 1j and 2f–h). Finally, supplementation of l-carnitine was sufficient to partly rescue the sensitivity to DNA-damaging agents in Kuramochi cells (Extended Data Fig. 2i) and modestly increased cisplatin IC50 in FT282 parental cells (Extended Data Fig. 1m). Together, these data place carnitine downstream of αKG and demonstrate the necessity of the αKGDD TMLHE and the de novo carnitine-synthesis pathway for resistance to DNA-damaging agents in HR-proficient models (Fig. 1o).
The alternative text for this image may have been generated using AI.Full size imagea, Schematic of the de novo carnitine-synthesis pathway. Succ, succinate. b, Carnitine abundance was assessed in cells treated with IDH1i and supplemented with αKG (FT282-CCNE1: control, n = 8; IDH1i, n = 7; IDH1i + αKG, n = 7; Ovcar8-CCNE1, n = 8; technical replicates are representative of three independent experiments for each cell-line pair). c, l-Carnitine abundance was assessed in cells cultured in normal media or glutamine starved (GS) supplemented with αKG (FT282-CCNE1: n = 8; Ovcar8-CCNE1: control, n = 8; IDH1i, n = 8; IDH1i + αKG, n = 7; technical replicates are representative of three independent experiments for each cell-line pair). d, Same as b, but acetylcarnitine was assessed (n = 8 technical replicates are representative of three independent experiments for each cell line. e, Same as c, but acetylcarnitine was assessed (n = 8 technical replicates representative of three independent experiments for each cell line). f, Ovcar8-CCNE1 cells were injected intraperitoneally into mice. Mice were treated with vehicle (n = 8 per group) or the IDH1 inhibitor (n = 6 per group). At the end point, omental tumours were collected for analysis of the indicated metabolites. g, Schematic of d9-TML tracing into d9-HTML. h, The d9-HTML:d9-TML ratio was assessed in FT282-CCNE1 cells treated with the IDH1i alone or supplemented with αKG (n = 8 technical replicates representative of two independent experiments). Graphs represent mean ± s.d. In b–e and h, one-way ANOVA was followed by Sidak’s multiple comparisons test. In f, two-tailed Student’s t-test.
Carnitine is needed to transport short and long acyl groups across the inner mitochondrial membrane, and acylcarnitines are known to be important for both energy production and redox balance22,23. Surprisingly, l-carnitine and acetylcarnitine, but not propionylcarnitine or butyrylcarnitine, rescued the sensitivity to DNA-damaging agents in combination with IDH1 inhibition, glutamine starvation, TMLHE knockdown, carnitine synthesis inhibition or succinate supplementation (Supplementary Fig. 3). The antioxidant n-acetyl-l-cysteine (NAC) also did not rescue the observed effects (Supplementary Fig. 4). Because experiments using propionylcarnitine/butyrylcarnitine or NAC did not phenocopy the l-carnitine supplementation, these data indicate that cellular energetics and/or reactive oxygen species do not contribute to the observed effects.
Next, we aimed to confirm that the observed changes in histone acetylation drive resistance to DNA-damaging agents. Indeed, CCNE1-driven cells were sensitized to DNA-damaging agents by a histone acetyltransferase (HAT) inhibitor (Extended Data Fig. 5a,b). This sensitivity to DNA-damaging agents was not rescued by αKG, l-carnitine or acetylcarnitine (Extended Data Fig. 5a,b), corresponding to the inability of αKG, l-carnitine or acetylcarnitine to rescue histone acetylation following treatment with the HAT inhibitor (Extended Data Fig. 5c,d). Neither propionylcarnitine nor butyrylcarnitine supplementation rescued the sensitivity of αKG- or carnitine-depleted cells to DNA-damaging agents (Supplementary Figs. 3 and 4). Together, these data reinforce the model that αKG and carnitine are upstream of histone acetylation to drive resistance to DNA-damaging agents directly.
Next, we aimed to quantify how much acetyl-CoA is provided for acetylation by the (acetyl)carnitine pool. We performed 13C2-acetylcarnitine tracing and found that around 5–8% of cellular acetyl-CoA is derived from supplemented acetylcarnitine (Extended Data Fig. 6a). To further validate the role of the endogenous carnitine shuttle to the observed histone acetylation, we knocked down carnitine O-acetyltransferase (CrAT) and carnitine O-octanoyltransferase (CrOT) (Extended Data Fig. 6b and Supplementary Fig. 5a,b). Knockdown of CrAT or CrOT decreased histone acetylation (Extended Data Fig. 6c,d). Consistent with the notion that this axis directly promotes histone acetylation, supplementation with acetylcarnitine, but not l-carnitine, rescued histone acetylation in cells with knockdown of CrAT (Extended Data Fig. 6c). Acetylcarnitine supplementation did not rescue histone acetylation in cells with knockdown of CrOT (Extended Data Fig. 6d). To further confirm that the endogenous carnitine shuttle provides an acetyl-CoA pool that can be used for histone acetylation, we conducted 13C6-glucose tracing in cells with knockdown of the carnitine acetyltransferases CrAT and CrOT. Knockdown of CrAT or CrOT significantly decreased glucose-derived acetyl-CoA to around 50% of the level in controls (Extended Data Fig. 6e). This phenocopied the decrease in glucose-derived acetyl-CoA pools following knockdown of the de novo carnitine-synthesis enzyme TMLHE (Extended Data Fig. 6e). This was not due to decreased bulk acetyl-CoA (Extended Data Fig. 6f). Consistent with the idea that this axis is required for resistance to DNA-damaging agents, knockdown of either CrAT or CrOT, which decreased histone acetylation (Extended Data Fig. 6c,d), increased sensitivity to DNA-damaging agents (Extended Data Fig. 6g,h and Supplementary Fig. 5c,d). We observed that knockdown of TMLHE decreased the nuclear pool of acetyl-CoA (Fig. 3j and Supplementary Fig. 5e). Together, these data demonstrate that the de novo carnitine-synthesis pathway provides a nuclear pool of acetyl-CoA for histone acetylation.
We next aimed to gain a more global understanding of the specific histone acetylation marks that are regulated by the αKG–carnitine axis. Multiple site-specific acetylation marks were downregulated by IDH1 inhibition or knockdown (Extended Data Fig. 8a, Supplementary Fig. 6a and Supplementary Table 3). We further determined that multiple acetylation marks were rescued by αKG or l-carnitine (Extended Data Fig. 8a). Similarly, knockdown of TMLHE decreased multiple histone acetylation marks, many of which were rescued by l-carnitine (Extended Data Fig. 8b). Notably, the addition of carnitine or knockdown of TMLHE did not have marked effects on histone methylation (Extended Data Fig. 8c). Cross-comparison of these datasets identified three histone acetyl marks—H3K23ac, H4K8ac and H4K12ac—that were specifically sensitive to regulation by the αKG–TMLHE–carnitine axis and validated in multiple cell lines under different conditions (Fig. 3g, Extended Data Fig. 4i−l, Extended Data Fig. 8d and Supplementary Fig. 6b,c). 13C2-acetylcarnitine can be directly traced into these three site-specific histone marks (Extended Data Fig. 8e). Together, our data provide evidence that αKG contributes to site-specific histone acetylation by acting as a co-substrate for the carnitine-synthesis enzyme TMLHE.
αKG is well known for its role in DNA and histone demethylation by acting as a co-substrate for αKGDDs2. We report that αKG drives acetylation to promote HR-mediated DNA DSB repair in HR-proficient models. We discovered that αKG-dependent histone acetylation occurs through TMLHE-mediated de novo carnitine synthesis. We also provide clinical evidence that this axis is relevant in ovarian cancer patient samples. This study provides a new link between αKG and site-specific histone acetylation and opens up avenues of exploration into the epigenetic and translational consequences of altered αKG levels that occur in cancer, ageing and stem cell development.
Epigenetic modifications such as histone PTMs are metabolically sensitive10. Previous studies have shown that depletion of αKG, for instance through mutations in IDH1 or IDH2 that instead produce the oncometabolite D-2HG, inhibits αKGDD activity, leading to changes in DNA and histone methylation12,13,14,15,17,18. To our knowledge, this is the first report of αKG promoting site-specific histone acetylation, and we posit that acetylation events are probably affected in these other biological scenarios in which αKG is depleted. A paper from 2025 showed that cells with IDH1 mutations have increased histone acetylation, although this was not linked to either αKG or 2HG31. Histone acetylation for DSB repair by HR is partly controlled by nuclear–cytosolic acetyl-CoA pools32, and previous work has demonstrated that the endogenous acyl carrier l-carnitine has an active role in histone acetylation by shuttling acetyl units in the form of acetylcarnitine from the mitochondria and/or the peroxisome and acting as a nuclear acetyl-CoA precursor24,25. In this study, we have identified an upstream regulator of the carnitine–histone acetylation axis through the αKGDD TMLHE. We note that, unlike previous reports24,25, the carnitine-mediated histone acetylation occurred even in cells with an intact ACLY pathway, demonstrating an expanded role for carnitine in shuttling acetyl-CoA groups. Indeed, we determined that ACLY and the de novo carnitine-synthesis pathway provide non-redundant nuclear acetyl-CoA pools for histone acetylation. Why both pathways are required in these cells remains unclear.
Studies have found that inhibiting αKGDD activity through mutations in IDH1 or IDH2, fumarate hydratase or succinate dehydrogenase increases sensitivity to DNA-damaging agents, and the mechanisms described are due to changes in methylation12,13,14,15,16,17,18. What our study shows for the first time to our knowledge is that this phenomenon occurs through histone acetylation and subsequent HR-mediated DNA repair. Previous work has shown that histone acetylation is implicated in promoting the DNA damage response, both directly and indirectly9. We demonstrate that αKG-mediates HR, and that this is a more direct effect of histone acetylation on either chromatin relaxation or recruitment of repair factors. Notably, we found multiple acetylation sites that are sensitive to αKG-mediated carnitine synthesis. A previous paper showed that differential usage of nucleo-cytosolic acetyl-CoA pools, as well as differential metabolic enzyme–HAT interactions, can regulate site-specific histone acetylation33. Our work also pre-produces the paradigm that site-specific histone acetylation marks can be nutrient dependent.
Here we put forth a mechanism that underlies the inherent resistance of HR-proficient tumours to DNA-damaging agents through αKG–carnitine–histone acetylation, owing to their high basal DNA damage and subsequent elevated reliance on HR for survival. Our data demonstrate a therapeutic approach in these difficult-to-treat cancers. Moreover, supplementation of αKG or carnitine decreased the sensitivity in other models, and we found that some patients with high TMLHE are not high in cyclin E1. Thus, our data point to an overall general model of αKG and carnitine in therapeutic response beyond CCNE1 or MYC. There is evidence in other cancer types demonstrating that inhibition of wild-type IDH1 is synergistic with chemotherapy, although these studies focused on redox balance and reactive oxygen species34,35,36. Glutamine starvation (or glutaminase inhibition) has been shown to have similar effects, resulting in part from decreased glutathione and redox imbalance37,38,39,40. We did not see rescue using the antioxidant NAC, indicating that multiple context-dependent mechanisms are at play. Our studies have high translational potential given the availability of mildronate and the safety profile in humans29,30. Future studies will further explore the therapeutic potential of mildronate in other cancers, as well as the contribution, or lack thereof, of the immune system and microbiome. Moreover, carnitine is also an essential part of the diet and is enriched in foods such as milk, meat, fish and cheese41, and it will therefore be interesting in future studies to determine the contribution of dietary carnitine to histone acetylation and HR proficiency. Finally, we found that high serum acetylcarnitine levels are associated with worse PFS in patients treated with platinum therapies. It is therefore also possible that circulating acetylcarnitine is a biomarker of therapeutic response.
In summary, we found that αKG is required for histone acetylation through TMLHE-catalysed carnitine synthesis to facilitate HR-mediated DNA repair in multiple cellular contexts. This finding provides targetable insights into the mechanism underlying the metabolic–epigenetic axis driving HR-proficiency-mediated resistance to DNA-damaging agents. Moreover, our data provide evidence of an unappreciated function of αKG, in addition to its known roles in demethylation, in which αKG promotes carnitine synthesis to support histone acetylation directly. This should prompt a re-appraisal of the role of αKG in physiology and disease through mechanisms other than the αKG-dependent DNA and histone demethylases.
The following antibodies were obtained from the indicated suppliers. Primary antibodies: rabbit anti-IDH1 (8137S, RRID: AB_10950504, WB 1:1000) from Cell Signaling Technology; rabbit anti-TMLHE (16621-1-AP, RRID:AB_2205303, WB 1:1000) from Proteintech; rabbit anti-TMLHE (HPA034589, RRID:AB_10670571, IHC 1:100) from ATLAS; mouse anti-cyclin E1 (4129S, RRID:AB_2071200, clone HE12, WB 1:1000) from Cell Signaling Technology; mouse anti-Cyclin E1 (HPA018169, RRID: AB_1847384, IHC 1:500) from Sigma Aldrich; rabbit anti-MYC (13987, RRID: AB_2631168, clone D3N8F, WB 1:1,000) from Cell Signaling Technology; mouse anti-vinculin (V9131, RRID: AB_477629, clone hVIN-1, WB 1:1,000) from Sigma Aldrich; rabbit pan-acetyl H3 (61638, RRID: AB_2793714, WB 1:1000, IHC 1:1,000) from Active Motif; rabbit Total Histone H3 (05-928, RRID: AB_492621, clone A3S, WB 1:1,000) from Millipore; rabbit pan-acetyl H4 (39925, RRID: AB_2687872, WB 1:1,000, IHC 1:1,000) from Active motif; rabbit Total Histone H4 (13919S, RRID: AB_2798345, clone D2X4V, WB 1:1,000) from Cell Signaling Technology; rabbit H4K8ac (GTX128957, RRID: AB_2885846, WB 1:1,000, IHC 1:1,000) from GeneTex; rabbit H4K12ac (13944S, RRID: AB_2798350, clone D2W60, WB 1:1,000) from Cell Signaling Technology; rabbit H4K23ac (39131, RRID: AB_2793165, WB 1:1,000) from Active Motif; rabbit H3K23ac (PA5-109818, RRID: AB_2855229, IHC 1:50) from Thermo; rabbit pan-acetyl H3 (PA5-114693, RRID: AB_2899329, IHC 1:200) from Thermo; rabbit H4K12ac (ab177793, RRID: AB_2651187, clone EPR17906, IHC 1:1,000) from Abcam; mouse anti-Beta Actin (A1978, RRID: AB_476692, clone AC-15, WB 1:1,000) from Sigma Aldrich; rat anti-BrdU (ab6326, RRID: AB_305426, clone BU1/75 (ICR1), IF 1:500) from Abcam; mouse anti-phospho-Histone H2A.X Ser139 (05-636, RRID: AB_309864, Clone JBW301, IF 1:500) from Millipore Sigma; rabbit anti-53BP1 (A300-272A, RRID: AB_185521, IF 1:500) from Bethyl; mouse BRCA1 (sc-6954, RRID:AB_626761, clone D-9, IF 1:500, WB 1:1,000) from Santa Cruz Biotechnology; rabbit anti-CrOT (13543-1-AP, RRID: AB_2085513, WB 1:1,000) from Proteintech; rabbit anti-CrAT (PAC400Mu01, WB 1:1,000) from Cloud-Clone Corp; rabbit anti-RAD51 (ab133534, RRID:AB_2722613, clone EPR4030(3), IF 1:500) from Abcam; mouse anti-PAR/pADPr (4335-MC-100, RRID:AB_2572318, clone 10HA, IF 1:500) from Biotechne; rabbit anti-ATP-citrate lyase (D1X6P) (ab13390, RRID:AB_2798203, clone D1X6P, WB 1:1,000), rabbit anti-G6PD (HPA000834, RRID: AB_1078977, WB 1:1,000) from Sigma Aldrich; mouse anti-LAMP2 (sc-18822, RRID: 626858, clone H4B4, WB 1:1,000) from Santa Cruz Biotechnology; rabbit anti- UGGT1 (14170-1-AP, RRID: 1288973, WB 1:1,000) from ThermoFisher Scientific; rabbit anti-HSP60 (D6F1) XP (ab12165, RRID:AB_2636980, clone D6F1, WB 1:1;000); normal mouse IgG (2025, RRID: AB_737182, ChIP 2 μg) from SantaCruz Biotechnology; normal rabbit IgG (2729S, RRID: AB_1031062, ChIP 2 μg) from Cell Signaling Technology; Histone H4K8ac (A7258, RRID: AB_2767802, WB 1:1,000) from ABclonal; Biotin (Bethyl, A15-109A, WB 1:1,000). Secondary antibodies: anti-mouse (7076, RRID:AB_330924, WB 1:5,000) and anti-rabbit (7074, RRID: AB_2099233, WB 1:5,000) horseradish peroxidase (HRP)-conjugated secondary antibodies from Cell Signaling Technology. For immunofluorescence, fluorescein donkey anti-rat IgG (712-095-150, RRID: AB_2340651, 1:5,000) from Jackson ImmunoResearch Laboratories; fluorescein donkey anti-mouse IgG (715-095-150, RRID: AB_2340792, 1:5,000) from Jackson ImmunoResearch Laboratories; fluorescein (FITC)-affinity pure donkey anti-rabbit (711-095-152, RRID: AB_2315776, 1:5,000) from Jackson ImmunoResearch Laboratories; Cy3Goat anti-rabbit (111-165-003, RRID: AB_2338000, 1:5,000) from Jackson ImmunoResearch Laboratories; Cy3-affinity pure donkey anti-mouse (715-165-150, RRID:AB_2340813, 1:5,000) from Jackson ImmunoResearch Laboratories.
Metabolites were measured by liquid chromatography–high-resolution mass spectrometry adapted from two previously published approaches for polar metabolites43 and acyl-CoAs44. For polar metabolomics of carnitines and tricarboxylic acid (TCA) cycle metabolites, samples were quenched in 1 ml pre-chilled at −80 °C 80:20 methanol:water (vol/vol) and spiked with 50 µl 1 µM isotope-labelled TCA cycle mix (Cambridge Isotope Laboratories, MSK-TCA-A) prediluted in 80:20 methanol:water and 50 µl 0.02 ng µl−1 propionyl-l-carnitine-(N-methyl-d3) (Sigma Aldrich, 52941). After vortexing for 1 min, samples were returned to −80 °C for 30 min, centrifuged at 18,000g for 10 min at 4 °C, and the supernatant was transferred to a deep-well 96-well plate and evaporated to dryness under nitrogen gas. Samples were reconstituted in 100 µl, and 2 µl of the sample was injected from a 4 °C autosampler into a ZIC-pHILIC 150 × 2.1 mm 5 µm particle size column (EMD Millipore) with a ZIC-pHILIC 20 × 2.1 guard column in a Vanquish Duo UHPLC system (Thermo Fisher Scientific) at 25 °C. Chromatography conditions were as follows: buffer A was acetonitrile; buffer B was 20 mM ammonium carbonate, 0.1% (vol/vol) ammonium hydroxide in water without pH adjustment, with a gradient of 0.5 min at 20% A, then a linear gradient from 20% to 80% B; 20–20.5 min: from 80% to 20% B; 20.5–28 min: hold at 20% B at a 0.150 ml min−1 flow rate. Column elute was introduced to a Q Exactive Plus with a HESI II probe operating in polarity switching mode with full scans from 70 to 1,000 m/z with an insource fragmentation energy of 1. Acyl-CoA quantification and isotope tracing were measured by liquid chromatography–high-resolution mass spectrometry, as previously described in detail45 with internal standards generated as described46. In brief, samples were quenched in 1 ml 10% (wt/vol) trichloroacetic acid in water for extraction. Samples were homogenized by using a probe tip sonicator in 0.5-s pulses 30 times then centrifuged at 17,000g for 10 min at 4 °C. Supernatant was purified by solid-phase-extraction cartridges (Oasis HLB 10 mg, Waters) that were conditioned with 1 ml of methanol and 1 ml of water. Acid-extracted supernatants were loaded onto the cartridges and washed with 1 ml of water. Acyl-CoAs were eluted with 1 ml of 25 mM ammonium acetate in methanol and evaporated to dryness under nitrogen. Samples were resuspended in 50 µl of 5% (wt/vol) 5-sulfosalicyilic acid and 20-µl injections were analysed on an Ultimate 3000 UHPLC using a Waters HSS T3 2.1 × 100 mm 3.5 µm column coupled to a Q Exactive Plus with a HESI II probe operating in positive-ion mode.
The analysts were blinded to sample identity during processing and quantification. Instruments were controlled using XCalibur v.4.1 and data were analysed on Tracefinder 5.1 using a 5-p.p.m. window from the predominant ion, either positive (carnitines and acyl-CoAs) or negative (all other analytes). The area under the curve for each analyte was normalized to the matched internal standard or the nearest surrogate internal standard. For isotope tracing, isotopologue enrichment was calculated using FluxFix: Isotopologue Analysis tool (v.0.1)47.
For all experiments, an equal number of cells was seeded in 96-well plates. For IDH1 inhibitor, carnitine synthesis inhibitor and HAT inhibitor studies: cells were treated for 5 days with IC10–20 doses of GSK864, mildronate, HAT inhibitor or metabolites (see Supplementary Table 1 for concentrations). For glutamine-starvation assays, cells were seeded in standard growth medium. The next day, the medium was changed to glutamine-free medium (Fischer Scientific, 21870076) with or without metabolite supplementation for 5 days. On the fifth day, cells were also treated with olaparib or cisplatin (see Supplementary Table 1 for concentrations) every other day for 5 more days. For gamma-radiation experiments, cells were irradiated once on the fifth day. For TMLHE-knockdown experiments, cells were transduced, selected and seeded into 96-well plates. Cells were subsequently treated with olaparib or cisplatin and metabolites (see Supplementary Table 1 for concentrations) every other day for 5 days. For all experiments, the percentage relative survival was assessed at the end point by fixing the plates in 1% paraformaldehyde for 5 min, after which they were stained with 0.05% crystal violet. Wells were de-stained using 10% acetic acid. Absorbance (at 590 nm) was measured using a spectrophotometer (BioTek Epoch Microplate reader). The percentage relative survival was calculated by normalizing to the appropriate controls indicated in the figure legends.
Cells lysates were collected in 1× sample buffer (2% SDS, 10% glycerol, 0.01% bromophenol blue, 62.5 mM Tris, pH 6.8, 0.1 M DTT), boiled to 95 °C for 10 min and sonicated. Protein concentration was determined using the Bradford assay (Bio-Rad, 5000006). An equal amount of total protein was resolved using SDS–PAGE gels and transferred to nitrocellulose membranes (Fisher Scientific) at 110 mA for 2 h at 4 °C. Membranes were blocked with 5% non-fat milk or 4% BSA in TBS containing 0.1% Tween-20 (TBS-T) for 1 h at room temperature. Membranes were incubated overnight at 4 °C in primary antibodies in 4% BSA/TBS + 0.025% sodium azide. Membranes were washed four times in TBS-T for 5 min at room temperature after which they were incubated with HRP-conjugated secondary antibodies in 5% milk/TBS-T for 1 h at room temperature. After washing four times in TBS-T for 5 min at room temperature, proteins were visualized on film after incubation with SuperSignal West Pico PLUS Chemiluminescent Substrate (ThermoFisher).
We constructed a pooled sgRNA library containing 64 sgRNAs targeting various genes whose enzymes require αKG as a co-factor for their activity in addition to controls targeting intragenic regions, as described previously48. We used publicly available CRISPR sgRNA design tools that optimize on-target and minimize off-target genome editing (http://crispr.dfci.harvard.edu/SSC/) and pooled human metabolic library49 to identify ten sgRNAs for each gene. The pooled oligonucleotide library was synthesized by Twist Bioscience. The oligonucleotide library was cloned as previously described48 into lentiCRISPRv2, (Addgene, 52961). In brief, the pooled oligonucleotide library was amplified using NEB Next High-Fidelity PCR Master Mix (New England Biolabs, M0541S). The purified target gRNA library and digested backbone were assembled in a Gibson assembly reaction (New England Biolabs, E2611L) and isopropanol precipitated using GlycoBlue Coprecipitant (Invitrogen, AM9515) following the manufacturer’s instructions. To ensure optimal sgRNA representation, the library was sequenced, obtaining a coverage of more than 95%. The library was sequenced to ensure optimal sgRNA representation achieving 100% coverage. The sgRNA sequences can be found in Supplementary Table 2.
The human αKG dioxygenases CRISPR knockout library containing 64 genes that require αKG as a co-factor for their activity was designed as stated above. The screening was conducted on Ovcar8/Ovcar8-CCNE1 and FT282/FT282-CCNE1 isogenic cells. In brief, the appropriate number of cells were infected with pooled libraries at MOI < 0.3 to achieve more than 400-fold library coverage after selection. Selection was conducted with 500 μg of Geneticin (Thermo Fischer Scientific, 10131035) for six days. Cells were passaged every two days and the whole population was seeded to maintain the library coverage throughout. After selection, the whole amplified cell population was seeded at a ratio of 500,000 cells per 100 mm dish and treated for four days with DMSO or olaparib (4.213 μM for Ovcar8 and 4.413 μM for FT282). At the end of the experiments, cells were collected for genomic DNA extraction using the Zymo Research kit (D4069). The sgRNA inserts were PCR amplified using Ex Taq DNA polymerase (Takara, RR001A) from sufficient genome equivalents of DNA to achieve an average coverage of more than 200× of the sgRNA library (Supplementary Table 4). Pooled PCR amplicons were then sequenced using the MiSeq V2 50 cycle kit on an Illumina MiSeq sequencer. MAGeCK (0.5.9) was used as the bioinformatics pipeline to analyse negatively enriched genes. Data in Fig. 1i represent log2-fold change of negative score in (CCNE1 + olaparib versus CCNE1) versus negative score in (EV + olaparib versus EV). Processed CRISPR data and counts for each gRNA targeting TMLHE can be found in Supplementary Table 2.
IHC was done as described previously50 with slight modifications. After deparaffinization and rehydration, tissues were steamed for 40 min in 1× citrate buffer (Sigma-Aldrich, C9999), after which they were immersed in 3% MeOH for 20 min. Tissues were blocked with 1% BSA in PBS for 30 min before overnight incubation in primary antibodies. A mouse- and rabbit-specific HRP/DAB (ABC) detection IHC kit (Abcam, 4264) was used for visualization of staining. Tissues were incubated in Mayer’s haematoxylin solution (Sigma-Aldrich, MHS16) for 3 min followed by bluing in running tap water for 2 min. Tissues were dehydrated and mounted in Cytoseal (Sigma-Aldrich, C23-244257). QuPath v.0.6 was used for H-score analysis and to analyse the percentage of positive cells.
Stable isotope labelling of essential nutrients in cell culture (SILEC) subcellular fractionation was done on HepG2 cells as previously described using SILEC media containing 15N113C3-pantothenate (vitamin B5)51. For fractionation, all steps were performed on ice. SILEC HepG2 and FT282-CCNE1 cell dishes were washed twice with ice-cold 1x PBS, and cells were scraped into ice-cold PBS. Before nuclear fractionation, 1.35 million SILEC HepG2 cells were added to around 1 million FT282-CCNE1 cells. The FT282-CCNE1/SILEC-HepG2 cell mixture was centrifuged at 400g for 5 min at 4 °C. The pellet was resuspended in 250 μl lysis buffer (10 mM HEPES, pH 7.5, 10 mM KCl, 0.1 mM EDTA, 1 mM DTT, 0.1% IGEPAL and 1× protease inhibitor cocktail) and incubated on ice for 20 min with gentle mixing every 5 min. The lysate was briefly vortexed and then centrifuged at 12,000g for 10 min at 4 °C. The nuclear pellet was washed four times by resuspending in 200 μl of lysis buffer and centrifuging at 200g for 5 min at 4 °C. Next, the nuclear pellet was resuspended in fractionation buffer (2 M sucrose, 1 mM MgCl2, 10 mM Tris-HCl, pH 7.4) and centrifuged at 16,000g for 30 min at 4 °C. The supernatant was discarded and nuclei were washed twice by resuspending in 200 μl of lysis buffer and centrifuging at 200g for 5 min at 4 °C. Then, 400 μl of 10% (wt/vol) trichloroacetic acid was added to nuclei, before storage at −80 °C. Acetyl-CoA was assessed as described in Metabolite measurement, and protein lysates were assessed for fractionation purity as described in Western blotting.
The cell pellet was resuspended in nuclear isolation buffer (15 mM Tris-HCl, pH 7.5, 60 mM KCl, 15 mM NaCl, 5 mM MgCl2, 1 mM CaCl2, 250 mM sucrose, 1 mM DTT, 1:100 Halt Protease Inhibitor Cocktail (Thermo Scientific, 78430) and 10 mM sodium butyrate). Nuclei were resuspended in 0.2 M H2SO4 for 1 h at room temperature and centrifuged at 4,000g for 5 min. Histones were precipitated from the supernatant by the addition of trichloroacetic acid at a final concentration of 20% (wt/vol). Precipitated histones were pelleted at 10,000g for 5 min, washed once with 0.1% HCl in acetone and twice with acetone followed by centrifugation at 14,000g for 5 min. Histones were air dried then resuspended in 10 μl of 0.1 M (NH)4HCO3 for derivatization and digestion, according to ref. 52. Peptides were resuspended in 100 μl 0.1% trifluoroacetic acid (TFA) in water for liquid chromatography–tandem mass spectrometry (LC-MS/MS) analysis.
Raw MS files were imported and analysed in Skyline 23.1 software with Savitzky–Golay smoothing55. Automatic peak assignments from Skyline were manually confirmed. Peptide peak areas from Skyline were used to determine the relative abundance of each histone modification by calculating the peptide peak area for a peptide of interest and dividing by the sum of the peak areas for all peptides with that sequence. The relative abundances were determined on the basis of the mean of three technical replicates with error bars representing the standard deviation.
For analysing 13C2-acetylcarnitine-labelled histones, samples were resuspended in 10 µl of 0.1% TFA and loaded onto a Dionex RSLC Ultimate 300 (Thermo Scientific), coupled online with an Orbitrap Fusion Lumos (Thermo Scientific). Chromatographic separation was performed with a two-column system, consisting of a C-18 trap cartridge (300 µm ID, 5 mm long) and a picofrit analytical column (75 µm ID, 25 cm long) packed in-house with reversed-phase Repro-Sil Pur C18-AQ 3 µm resin. Peptides were separated using a 30 min gradient of 1–30% buffer B (buffer A, 0.1% formic acid; buffer B, 80% acetonitrile + 0.1% formic acid) at a flow rate of 300 nl min−1. The mass spectrometer was set to acquire spectra in a data-independent acquisition mode. In brief, the full MS scan was set to 300–1,100 m/z in the orbitrap with a resolution of 120,000 (at 200 m/z) and an AGC target of 5 × 10⁵. MS/MS was performed in the orbitrap with sequential isolation windows of 50 m/z with an AGC target of 2 × 10⁵ and an HCD collision energy of 30. Histone peptides raw files were imported into the EpiProfile 2.0 software56 using the 13C acetyl-labelling option. From the extracted ion chromatogram, the area under the curve was obtained and used to estimate the abundance of each peptide. Then, the relative amount of labelling was determined by comparing the unlabelled versus the labelled modified peptide. The resulting peptide lists generated by EpiProfile were exported to Microsoft Excel and further processed for a detailed analysis. The raw data have been deposited in the PRIDE (ProteomeXchange) database (project accession code: PXD060690).
Cells were seeded at an equal density on coverslips and fixed with 4% paraformaldehyde. Cells were washed four times with PBS and permeabilized with 0.2% Triton X-100 in PBS for 5 min. Cells were blocked for 5 min with 3% BSA/PBS followed by incubation of corresponding primary antibody (see above for catalogue numbers and dilutions) in 3% BSA/PBS for 1 h at room temperature. Cells were washed three times with 1% Triton X-100 in PBS and incubated with secondary antibody in 3% BSA/PBS for 1 h at room temperature. Cells were then incubated with 0.15 µg ml−1 DAPI for 1 min, washed three times with PBS, mounted with fluorescence mounting medium (9 ml of glycerol (BP229-1, Fisher Scientific), 1 ml of 1× PBS and 10 mg of p-phenylenediamine (PX0730, EMD Chemicals); the pH was adjusted to 8.0–9.0 using carbonate-bicarbonate buffer (0.2 M anhydrous sodium carbonate, 0.2 M sodium bicarbonate)) and sealed. For DNA damage foci and RAD51 foci, at least 200 cells per coverslip were counted. Cells were considered positive when they contained more than ten γH2AX foci or more than five RAD51 foci.
For U2OS-mCherry-LacI-Fok1 cells, DSBs were induced as described above. Cells were treated with the following inhibitors and metabolites: GSK864 (10 μM), αKG (1 mM), l-carnitine (1 mM) and O-acetyl-l-carnitine (1 mM) for a period of five days, followed by inducing the DSBs with Tamoxifen (1 μM) and Shield-1 (1 μM) for a period of 4 h. After 4 h, the cells were fixed and immunofluorescence was carried out by staining only for DAPI and mCherry and DSB foci were counted. For RAD51-DSB and BRCA1-DSB co-localization, immunofluorescence was done in the manner described above using RAD51 or BRCA1 primary antibody and fluorescein donkey anti-mouse IgG secondary antibody (1:5,000). For quantification, RAD51-mCherry or BRCA1-mCherry co-localization was assessed by counting their overlap in more than 150 cells per coverslip.
For BrdU, cells on coverslips were incubated with 1 μmol l−1 BrdU for 30 min. Cells were fixed with 4% paraformaldehyde, permeabilized with 0.2% Triton X-100 and then post-fixed with 1% paraformaldehyde + 0.01% Tween-20. Coverslips were treated with DNaseI for 10 min, and the DNaseI reaction was stopped using 20 mmol l−1 EDTA. Coverslips were then blocked with 3% BSA/PBS and incubated in anti-BrdU primary antibody (1:500) followed by incubation in FITC anti-rat secondary antibody (1:1,000). For experiments to assess nuclear PAR levels in S phase, coverslips were incubated simultaneously with BrdU and PAR primary antibodies and then with corresponding secondary antibodies. Finally, coverslips were incubated with 0.15 μg ml−1 DAPI, mounted and sealed. Images were obtained at room temperature using a Nikon ECLIPSE Ti2 microscope equipped with a 20×/0.17 objective lens (Nikon DIC N2 Plan Apo). Images were acquired using NIS-Elements AR software and processed using ImageJ. To assess nuclear PAR in S phase, only BrdU-positive cells were analysed. Images were thresholded and nuclear PAR intensity was quantified using DAPI as a region of interest mask in ImageJ.
DSB reactions were performed in Xenopus egg extracts using a combination of high-speed supernatant (HSS) and nucleoplasmic extract (NPE), as described previously26. In brief, 5 ng μl−1 of plasmid DNA was first incubated in HSS supplemented with ATP regeneration mix (ARM; 6.5 mM phosphocreatine, 0.65 mM ATP and 1.6 μg ml−1 creatine phosphokinase) and 10 μM nocodazole at 21 °C for 20 min. Next, NPE supplemented with ARM and 3.5 mM DTT was added at a 2:1 ratio. To radiolabel plasmid DNA, reactions were supplemented with [α−32P] dATP. Reactions were then incubated at 21 °C for 45 min and AgeI (0.25 U μl−1; Thermo Fisher) was added to generate a single DSB in a plasmid containing an AgeI site. Where indicated, reactions were also supplemented with IDH1i (500 μM) or αKG (500 μM). At the indicated time points, 1 μl of reaction liquid was withdrawn, diluted sixfold in replication stop dye (3.6% SDS, 18 mM EDTA, 90 mM Tris-HCl, pH 8, 90 mg ml−1 Ficoll and 3.6 mg ml−1 bromophenol blue), incubated with 20 mg proteinase K at 21 °C for 16 h and then resolved by 0.8% agarose gel electrophoresis. Agarose gels were dried and visualized by autoradiography.
DNA-bound proteins were isolated from Xenopus egg extracts as previously described57. In brief, reaction samples were withdrawn at the indicated times and incubated with LacI-coupled magnetic beads (Dynabeads M-280; Invitrogen) suspended in pull-down buffer (10 mM Hepes, pH 7.7, 50 mM KCl, 2.5 mM MgCl2, 250 mM sucrose, 0.25 mg ml−1 BSA and 0.02% Tween 20). Beads were rotated at 4 °C for 20 min and then washed with LacI wash buffer (10 mM Hepes, pH 7.7, 50 mM KCl, 2.5 mM MgCl2, 0.25 mg ml−1 BSA and 0.03% Tween 20), dried and then suspended with 5× sample buffer (250 mM Tris–HCl, pH 6.8, 10% SDS, 0.2% bromophenol blue, 30% glycerol and 500 mM β-mercaptoethanol). DNA-bound proteins were then resolved by SDS–PAGE and visualized by western blotting.
Samples were withdrawn from Xenopus egg extract reactions 30 min after IDH1 inhibition, quenched in cold methanol and then extracted and analysed by mass spectrometry as described above.
The Agilent Seahorse XFp Metabolic Analyzer (Agilent, model S7802A) was used to assess respiration in Xenopus egg extracts as recommended by the manufacturer for mitochondrial extracts. An XFp sensor cartridge was hydrated in Agilent Seahorse XF Calibrant (Agilent,103022-100) at 37 °C in a humidified incubator (non-CO2) incubator overnight. On the day of the experiment, extract was diluted 1:10 into mitochondrial assay solution (MAS; 70 mM sucrose, 220 mM mannitol, 10 mM KH2PO4, 5 mM MgCl2, 2 mM HEPES, 1 mM EGTA and 0.2 % (wt/vol) fatty acid-free BSA, pH 7.2). Then 25 µl of diluted extract was used in a Seahorse XFp cell culture plate (Agilent, 103022-100) and centrifuged at 2,000g for 20 min at 4 °C. After centrifugation, 155 µl of pre-warmed MAS with or without 10 mM succinate and 1 mM sodium pyruvate was added to the pelleted extract. Three basal-rate measurements (3 min each) were taken and the data analysed using Agilent Wave Desktop 2.6 software.
In brief, 2 μl of 1 μM MitoTracker Red (9082, Cell Signaling; diluted in 1× PBS) was added to 10 μl Xenopus egg extract (diluted 1:10 in 1× PBS). This was mixed gently and 2 μl was mounted on a slide for immediate imaging. Mitochondria were imaged at 40× magnification on a Nikon Eclipse Ti2 microscope with an ORCA-Fusion C14440 digital camera.
Total RNA was extracted from cells with Trizol (Ambion, 15596018) and DNase treated, cleaned and concentrated using Zymo columns (Zymo Research, R1013) following the manufacturer’s instructions. RNA was then retrotranscribed with a high-capacity cDNA reverse transcription kit (Applied Biosystems, 4368814) and 20 ng of cDNA amplified using the CFX Connect Real-time PCR system (Bio-Rad) and the PowerUp SYBR Green Master Mix (Applied Biosystems, A25742) following the manufacturer’s instructions. Primers for BRCA1: forwards, AGGAACCAGGGATGAAATCAG; reverse, TTTTCTGGATGCCTCTCAGC. Conditions for amplification were: 5 min at 95 °C, 40 cycles of 10 s at 95 °C, and 7 s at 62 °C. The assay ended with a melting curve program: 15 s at 95 °C, 1 min at 70 °C, then ramping to 95 °C while continuously monitoring fluorescence. Each sample was assessed in triplicate. Relative quantification was determined to multiple reference genes (human, PSMC4, PUM1 and B2M) to ensure reproducibility using the delta–delta CT method. For RNA-seq, RNA integrity number (RIN) was measured using a BioAnalyzer (Agilent Technologies) RNA 6000 nano kit to confirm a RIN greater than 7 for each sample. The cDNA libraries, next-generation sequencing and bioinformatics analysis was performed by Novogene. Raw and processed RNA-seq data can be found on GEO (GSE289735).
To assess single-stranded DNA (ssDNA) gaps, U2OS cells were pretreated with mildronate or vehicle for five days and then 10 μM olaparib for 2 h, similar to a previous report58. Cells were pulsed with 20 µM CldU in 1 ml fresh culture medium (DMEM supplemented with 10% heat-inactivated FBS and 1% penicillin–streptomycin) for 10 min at 37 °C, washed once with fresh media, pulsed with 200 µM IdU in 1 ml fresh culture media for 20 min at 37 °C and washed with 1× PBS. Cells were then permeabilized in 0.6 ml CSK100 buffer (100 mM NaCl, 10 mM HEPES, 3 mM MgCl2, 300 mM sucrose and 0.5% Triton X-100) for 10 min at room temperature, washed with 1× PBS, washed with 0.6 ml 1× S1 nuclease buffer (Invitrogen) containing 50 mM NaCl and incubated for 30 min at 37 °C in 0.6 ml 1× S1 nuclease buffer containing 50 mM NaCl, with or without 20 U ml−1 S1 nuclease (Invitrogen). The S1 nuclease buffer was removed, cells were scraped in 1 ml 0.1% BSA in 1× PBS and pelleted at 550g for 5 min and pellets were resuspended in 150 µl cold 1× PBS. DNA fibres were spread as described previously59 using 2 µl of cell sample and 7 µl of freshly made lysis buffer (200 mM Tris HCl, pH 7.4, 50 mM EDTA, 0.5% SDS). Slides were prepared in duplicate for each experimental condition. Spread fibres were dried for 10 min, fixed in freshly made 3:1 methanol:acetic acid for 5 min and dried for 7–8 min. Dried slides were stored overnight at 4 °C. The next day, slides were washed twice with 1× PBS for 5 min, incubated in 2.5 M HCl for 1 h at room temperature to denature the DNA, washed twice with 1× PBS for 5 min and blocked with 5% BSA/0.1% Triton X-100 in 1× PBS for 1 h at 37 °C in a humidified chamber. Slides were incubated with primary antibodies (rat anti-BrdU clone BU1/75 (ICR1) (Abcam, ab6326) at 1:50 to detect CldU; mouse anti-BrdU clone B44 (BD Biosciences, 347580) at 1:66.7 to detect IdU) in 2.5% BSA/0.1% Triton X-100 in 1× PBS overnight at 4 °C in a humidified chamber. The next day, slides were washed four times with 0.1% Tween-20 in 1× PBS for 5 min each and twice with 1× PBS for 5 min each. Slides were incubated with secondary antibodies (goat anti-rat Alexa Fluor 488 (Invitrogen, A11006) to label CldU; goat anti-mouse Alexa Fluor 594 (Invitrogen, A11005) to label IdU; both antibodies used at 1:150) in 2.5% BSA/0.1% Triton X-100 in 1× PBS for 1 h at 37 °C in a humidified chamber. Slides were washed four times with 0.1% Tween-20 in 1× PBS for 5 min each and twice with 1× PBS for 5 min each and were then air-dried and mounted using ProLong Diamond Antifade Mountant (Invitrogen). All the steps described above were performed with protection from light. Fibres were imaged at 60× (oil-immersion objective lens) magnification on a Nikon Eclipse Ti2 microscope with an ORCA-Fusion C14440 digital camera. The length of the IdU track in contiguous CldU and IdU tracks was measured using ImageJ.
ChIP was performed as described previously60. Using the U20S-DSB-reporter cell line, cells were first treated with their respective inhibitors and supplementation of αKG or l-carnitine and then induced for 4 h with 4-hydroxytamoxifen and Shield-1 for the induction of DSBs28. Cells were kept in charcoal-stripped FBS containing DMEM medium for all the treatments. After induction, the medium was removed by vacuum aspiration and cells were washed twice with 20 ml of ice-cold PBS. The cells were then incubated with 20 ml of serum-free low-glucose DMEM warmed to 20–22 °C. Immediately, 556 µl of 37% formaldehyde was added to each dish to reach a final concentration of 1%. The dishes were rocked at 10–15 r.p.m. for 10 min at 20–22 °C. The crosslinking was then quenched by adding 3 ml of 1 M glycine (dissolved in PBS) to obtain a final concentration of 125 mM glycine. The dishes were rocked at 10–15 r.p.m. for another 10 min at 20–22 °C. The formaldehyde-containing DMEM was removed and cells were washed three times with 20 ml of ice-cold PBS supplemented with 1× complete protease inhibitor cocktail. The cells were then scraped and collected in 10 ml of ice-cold PBS supplemented with 1× complete protease inhibitor using a plastic cell scraper and shifted into a 50 ml conical tube on ice. Another 10 ml of ice-cold PBS with 1× complete protease inhibitor was added to the same dish to collect residual cells and these were then transferred to the same 50-ml conical tube. The cells were spun down at 250g for 5 min at 4 °C and the supernatant was removed from the cell pellet. Cells were lysed in 1 ml ChIP lysis buffer (50 mmol l−1 HEPES-KOH, pH 7.5, 140 mmol l−1 NaCl, 1 mmol l−1 EDTA, pH 8.0, 1% Triton X-100 and 0.1% deoxycholate with 0.1 mmol l−1 PMSF and the EDTA-free protease inhibitor cocktail). Samples were incubated on ice for 10 min and then centrifuged at 3,000 r.p.m. for 3 min at 4 °C. The pellet was resuspended in 500 μl lysis buffer 2 (10 mmol l−1 Tris, pH 8.0, 200 mmol l−1 NaCl, 1 mmol l−1 EDTA and 0.5 mmol l−1 EGTA with 0.1 mmol l−1 PMSF and the EDTA-free protease inhibitor cocktail) and incubated at room temperature for 10 min. Samples were centrifuged at 3,000 r.p.m. for 5 min at 4 °C. Next, the pellet was resuspended in 300 μl lysis buffer 3 (10 mmol l−1 Tris, pH 8.0, 100 mmol l−1 NaCl, 1 mmol l−1 EDTA, 0.5 mmol l−1 EGTA, 0.1% DOC and 0.5% N-lauroylsarcosine with 0.1 mmol l−1 PMSF and the EDTA-free protease inhibitor cocktail). Cells were sonicated using a Branson Sonifier 250 for four cycles of 10 s on and 50 s off. Next, 30 μl of 10% Triton X-100 was added to each tube and then samples were centrifuged at maximum speed for 15 min at 4 °C. Antibody–bead conjugate solution (50 μl) was added to the supernatant, and chromatin was immunoprecipitated overnight on a rotator at 4 °C. The following washes were performed: ChIP lysis buffer, ChIP lysis buffer + 0.65 mol l−1 NaCl, wash buffer (10 mmol l−1 Tris-HCl, pH 8.0, 250 mmol l−1 LiCl, 0.5% NP-30, 0.5% deoxycholate and 1 mmol l−1 EDTA, pH 8.0) and TE (10 mmol l−1 Tris-HCl, pH 8.0, and 1 mmol l−1 EDTA, pH 8.0). DNA was eluted with TES (50 mmol l−1 Tris-HCl, pH 8.0, 10 mmol l−1 EDTA, pH 8.0, and 1% SDS) for 30 min at 65 °C. Reversal of crosslinking was performed by incubating samples overnight at 65 °C. Proteins were digested using 1 mg ml−1 proteinase K and incubating at 37 °C for 5 h. Finally, the DNA was purified using a Wizard SV Gel and PCR Clean Up Kit (Promega). Immunoprecipitated DNA was analysed by quantitative PCR using iTaq Universal SYBR Green Supermix (Bio-Rad) using primer 4 (ref. 28): forwards, CCACCTGACGTCTAAGAAACCAT; reverse, GATCCCTCGAGGACGAAAGG. Conditions for amplification were: 5 min at 95 °C, 40 cycles of 95 °C for 10 s and 30 s with 62 °C annealing temperature. The percentage input was calculated using the following formula: percentage \(\mathrm{input}=100\times {2}^{(\mathrm{adjustedinput}-{\mathrm{Ct}}_{\mathrm{IP}})}\), where adjustedinput = Ct input − 6.664, and CtIP indicates the threshold cycle value of the immunoprecipitated DNA.
Two TMAs were used. TMA 1 is a tissue microarray comprising serous tumours from ovarian cancer patients treated at the University of Colorado and was constructed as previously described61,62. Samples were collected under a University of Colorado institutional review board (IRB)-approved protocol (COMIRB #17-7788). The generation of the TMA was retrospective and patient information was de-identified, so a written informed consent was not required as deemed by COMIRB, as per the ethical standard defined by the Declaration of Helsinki. The TMA consisted of 109 primary tumours collected before chemotherapy, 19 primary tumours collected after chemotherapy, and 28 recurrent tumours that were subsequently treated with second-line chemotherapy. The time range of recurrence was 8–81 months. All tumours are shown in Fig. 5. A Kaplan–Meier survival curve was generated by correlating scores to PFS. Only recurrent patients were used for this analysis.
TMA 2 was received from the Cooperative Human Tissue Network (CHTN; CHTN OvCa2- Ovarian Carcinoma Survey). Only serous tumours were used for the analyses in this study.
Pretreatment (pre-surgery and pre-chemotherapy) blood was collected from patients with newly diagnosed epithelial ovarian cancer under University of Pittsburgh approved IRB protocols 20050019, 19070449 and 19060197. All participants were thoroughly briefed on the study and provided written informed consent. Inclusion criteria consisted of newly diagnosed, pathologically confirmed epithelial ovarian cancer, an age of 18 years or older, the ability to provide informed consent, willingness to provide access to medical records, undergoing interval or primary debulking surgery at UPMC/HCC, completing a full course (six cycles) of platinum-based chemotherapy at UPMC/HCC and willingness to provide biospecimens for banking purposes. Patients with a prior history of any cancer and those who had initiated any chemotherapy before enrolment were excluded from ProMark. Blood was collected in red-top tubes, centrifuged at 500g for 10 min and serum was aliquoted into cryopreservation tubes and stored at −80 °C until shipped to Metabolon for metabolomics analysis. Samples were shipped in a single batch to Metabolon to assess metabolite levels using the DiscoveryHD4 platform, which accurately identifies and quantitates more than 1,000 metabolites with less than 5% process variability using 100 µl of serum63. Samples were characterized using three independent platforms: ultrahigh-performance liquid chromatography with tandem mass spectrometry (UPLC–MS/MS) in the negative-ion mode, UPLC–MS/MS in the positive-ion mode and gas chromatography–mass spectrometry (GC–MS) after sialylation. Compounds were identified on the basis of chromatographic properties and mass spectra by comparing with a metabolomic library of purified standards.
Clinical data were extracted from the electronic medical. All patient primary diagnosis slides were reviewed by a single pathologist (E.E.) to confirm primary epithelial ovarian cancer diagnosis. Only patients completing a full course of primary platinum-based chemotherapy were included in this study.
GraphPad Prism v.10.0 and Rstudio (v.2023.09.1) were used to perform statistical analysis. Outliers were removed using PRISM outlier analysis (ROUT method). For cell culture experiments, sample sizes were not chosen on the basis of statistical methods. Sample sizes were chosen on the basis of extensive experience with the assays we have performed. Immunofluorescence analysis was done in a blinded way when possible, as was analysis of metabolomics experiments. This was not possible for the in vitro and in vivo studies, as these experiments were performed by individual investigators who were aware of the experimental groups and treatment outcome. Samples that did not correctly inject, judged by lack of signal for the internal standard, on the MS were also omitted from analysis. Mice that were euthanized before the study’s end point were also excluded from analyses. When comparing two groups, an unpaired, two-sided Student’s t-test was performed. When comparing the means of multiple groups to selected groups, a one-way ANOVA followed by post-hoc Šídák tests was applied. Time-to-event end points were assessed using the Kaplan–Meier method for visualization and the log-rank test for comparison. Also, Cox proportional hazards regression models were fit to evaluate continuous metabolite measurements, as well as to adjust for outcome-related covariates. P values are indicated in the figures. Heatmaps were generated using GraphPad Prism.
Further information on research design is available in the Nature Portfolio Reporting Summary linked to this article.
Konstantinopoulos, P. A., Ceccaldi, R., Shapiro, G. I. & D’Andrea, A. D. Homologous recombination deficiency: exploiting the fundamental vulnerability of ovarian cancer. Cancer Discov. 5, 1137–1154 (2015).
van Gent, D. C., Hoeijmakers, J. H. J. & Kanaar, R. Chromosomal stability and the DNA double-stranded break connection. Nat. Rev. Genet. 2, 196–206 (2001).
Brown, J. S., O’Carrigan, B., Jackson, S. P. & Yap, T. A. Targeting DNA repair in cancer: beyond PARP inhibitors. Cancer Discov. 7, 20–37 (2017).
Groelly, F. J., Fawkes, M., Dagg, R. A., Blackford, A. N. & Tarsounas, M. Targeting DNA damage response pathways in cancer. Nat. Rev. Cancer 23, 78–94 (2023).
Patch, A.-M. et al. Whole-genome characterization of chemoresistant ovarian cancer. Nature 521, 489–494 (2015).
Gong, F. & Miller, K. M. Histone methylation and the DNA damage response. Mutat. Res. Rev. Mutat. Res. 780, 37–47 (2019).
Gong, F. & Miller, K. M. Mammalian DNA repair: HATs and HDACs make their mark through histone acetylation. Mutat. Res. 750, 23–30 (2013).
Song, H. et al. Histone post-translational modification and the DNA damage response. Genes Dis. 10, 1429–1444 (2023).
Izzo, L. T., Affronti, H. C. & Wellen, K. E. The bidirectional relationship between cancer epigenetics and metabolism. Annu. Rev. Cancer Biol. 5, 235–257 (2021).
Losman, J.-A., Koivunen, P. & Kaelin, W. G. Jr 2-Oxoglutarate-dependent dioxygenases in cancer. Nat. Rev. Cancer 20, 710–726 (2020).
Molenaar, R. J. et al. IDH1/2 mutations sensitize acute myeloid leukemia to PARP inhibition and this is reversed by IDH1/2-mutant inhibitors. Clin. Cancer Res. 24, 1705–1715 (2018).
Wang, P. et al. Oncometabolite D-2-hydroxyglutarate inhibits ALKBH DNA repair enzymes and sensitizes IDH mutant cells to alkylating agents. Cell Rep. 13, 2353–2361 (2015).
Jiang, Y. et al. Local generation of fumarate promotes DNA repair through inhibition of histone H3 demethylation. Nat. Cell Biol. 17, 1158–1168 (2015).
Sulkowski, P. L. et al. Krebs-cycle-deficient hereditary cancer syndromes are defined by defects in homologous-recombination DNA repair. Nat. Genet. 50, 1086–1092 (2018).
Inoue, S. et al. Mutant IDH1 downregulates ATM and alters DNA repair and sensitivity to DNA damage independent of TET2. Cancer Cell 30, 337–348 (2016).
Dahl, E. S. et al. Targeting IDH1 as a prosenescent therapy in high-grade serous ovarian cancer. Mol. Cancer Res. 17, 1710–1720 (2019).
Lin, A.-P. et al. MYC, mitochondrial metabolism and O-GlcNAcylation converge to modulate the activity and subcellular localization of DNA and RNA demethylases. Leukemia 36, 1150–1159 (2022).
Qiu, Z. et al. MYC regulation of D2HGDH and L2HGDH influences the epigenome and epitranscriptome. Cell Chem. Biol. 27, 538–550 (2020).
Longo, N., Frigeni, M. & Pasquali, M. Carnitine transport and fatty acid oxidation. Biochim. Biophys. Acta 1863, 2422–2435 (2016).
Flanagan, J. L., Simmons, P. A., Vehige, J., Willcox, M. D. P. & Garrett, Q. Role of carnitine in disease. Nutr. Metab. 7, 30 (2010).
Izzo, L. T. et al. Acetylcarnitine shuttling links mitochondrial metabolism to histone acetylation and lipogenesis. Sci. Adv. 9, eadf0115 (2023).
Kuna, R. S. et al. Inter-organelle cross-talk supports acetyl-coenzyme A homeostasis and lipogenesis under metabolic stress. Sci. Adv. 9, eadf0138 (2023).
Barrows, J. K. et al. BRD4 promotes resection and homology-directed repair of DNA double-strand breaks. Nat. Commun. 13, 3016 (2022).
Pillay, N. et al. DNA replication vulnerabilities render ovarian cancer cells sensitive to poly(ADP-ribose) glycohydrolase inhibitors. Cancer Cell 35, 519–533 (2019).
Tang, J. et al. Acetylation limits 53BP1 association with damaged chromatin to promote homologous recombination. Nat. Struct. Mol. Biol. 20, 317–325 (2013).
Zhang, J., Cai, L.-J., Yang, J., Zhang, Q.-Z. & Peng, W.-X. Nonlinear pharmacokinetic properties of mildronate capsules: a randomized, open-label, single- and multiple-dose study in healthy volunteers. Fundam. Clin. Pharmacol. 27, 120–128 (2013).
Zhu, Y. et al. Efficacy and safety of mildronate for acute ischemic stroke: a randomized, double-blind, active-controlled phase II multicenter trial. Clin. Drug Investig. 33, 755–760 (2013).
Furth, N. et al. Oncogenic IDH1mut drives robust loss of histone acetylation and increases chromatin heterogeneity. Proc. Natl Acad. Sci. USA 122, e2403862122 (2025).
Sivanand, S. et al. Nuclear acetyl-CoA production by ACLY promotes homologous recombination. Mol. Cell 67, 252–265 (2017).
Ma, S. Nutrient-driven histone code determines exhausted CD8+ T cell fates. Science 387, eadj3020 (2025).
Zarei, M. et al. Wild-type IDH1 inhibition enhances chemotherapy response in melanoma. J. Exp. Clin. Cancer Res. 41, 283 (2022).
Vaziri-Gohar, A. et al. Limited nutrient availability in the tumor microenvironment renders pancreatic tumors sensitive to allosteric IDH1 inhibitors. Nat. Cancer 3, 852–865 (2022).
Zarei, M. et al. IDH1 inhibition potentiates chemotherapy efficacy in pancreatic cancer. Cancer Res. 84, 3072–3085 (2024).
Guo, J. et al. In vitro and in vivo analysis of metabolites involved in the TCA cycle and glutamine metabolism associated with cisplatin resistance in human lung cancer. Expert Rev. Proteomics 18, 233–240 (2021).
Gross, M. I. et al. Antitumor activity of the glutaminase inhibitor CB-839 in triple-negative breast cancer. Mol. Cancer Ther. 13, 890–901 (2014).
Mukhopadhyay, S. et al. Undermining glutaminolysis bolsters chemotherapy while NRF2 promotes chemoresistance in KRAS-driven pancreatic cancers. Cancer Res. 80, 1630–1643 (2020).
Shen, Y.-A. et al. Inhibition of the MYC-regulated glutaminase metabolic axis Is an effective synthetic lethal approach for treating chemoresistant ovarian cancers. Cancer Res. 80, 4514–4526 (2020).
Steiber, A., Kerner, J. & Hoppel, C. L. Carnitine: a nutritional, biosynthetic, and functional perspective. Mol. Aspects Med. 25, 455–473 (2004).
Petrova, B. et al. Redox metabolism measurement in mammalian cells and tissues by LC-MS. Metabolites 11, 313 (2021).
Kantner, D. S. et al. Comparison of colorimetric, fluorometric, and liquid chromatography-mass spectrometry assays for acetyl-coenzyme A. Anal. Biochem. 685, 115405 (2024).
Frey, A. J. et al. LC-quadrupole/Orbitrap high-resolution mass spectrometry enables stable isotope-resolved simultaneous quantification and 13C-isotopic labeling of acyl-coenzyme A thioesters. Anal. Bioanal. Chem. 408, 3651–3658 (2016).
Snyder, N. W. et al. Production of stable isotope-labeled acyl-coenzyme A thioesters by yeast stable isotope labeling by essential nutrients in cell culture. Anal. Biochem. 474, 59–65 (2015).
Trefely, S., Ashwell, P. & Snyder, N. W. FluxFix: automatic isotopologue normalization for metabolic tracer analysis. BMC Bioinformatics 17, 485 (2016).
Joung, J. et al. Genome-scale CRISPR-Cas9 knockout and transcriptional activation screening. Nat. Protoc. 12, 828–863 (2017).
Birsoy, K. et al. An essential role of the mitochondrial electron transport chain in cell proliferation is to enable aspartate synthesis. Cell 162, 540–551 (2015).
Huang, Z. et al. ATM inhibition drives metabolic adaptation via induction of macropinocytosis. J. Cell Biol. 222, e202007026 (2023).
Trefely, S. et al. Quantitative subcellular acyl-CoA analysis reveals distinct nuclear metabolism and isoleucine-dependent histone propionylation. Mol. Cell 82, 447–462 (2022).
Garcia, B. A. et al. Chemical derivatization of histones for facilitated analysis by mass spectrometry. Nat. Protoc. 2, 933–938 (2007).
Zheng, Y. et al. Total kinetic analysis reveals how combinatorial methylation patterns are established on lysines 27 and 36 of histone H3. Proc. Natl Acad. Sci. USA 109, 13549–13554 (2012).
Zheng, Y., Thomas, P. M. & Kelleher, N. L. Measurement of acetylation turnover at distinct lysines in human histones identifies long-lived acetylation sites. Nat. Commun. 4, 2203 (2013).
MacLean, B. et al. Skyline: an open source document editor for creating and analyzing targeted proteomics experiments. Bioinformatics 26, 966–968 (2010).
Yuan, Z.-F. et al. EpiProfile 2.0: a computational platform for processing epi-proteomics mass spectrometry data. J. Proteome Res. 17, 2533–2541 (2018).
Fullbright, G., Rycenga, H. B., Gruber, J. D. & Long, D. T. p97 promotes a conserved mechanism of helicase unloading during DNA cross-link repair. Mol. Cell. Biol. 36, 2983–2994 (2016).
Cong, K. et al. Replication gaps are a key determinant of PARP inhibitor synthetic lethality with BRCA deficiency. Mol. Cell 81, 3128–3144 (2021).
Quinet, A., Carvajal-Maldonado, D., Lemacon, D. & Vindigni, A. DNA fiber analysis: mind the gap! Methods Enzymol. 591, 55–82 (2017).
Leon, K. E. et al. DOT1L modulates the senescence-associated secretory phenotype through epigenetic regulation of IL1A. J. Cell Biol. 220, e202008101 (2021).
Jordan, K. R. et al. The capacity of the ovarian cancer tumor microenvironment to integrate inflammation signaling conveys a shorter disease-free interval. Clin. Cancer Res. 26, 6362–6373 (2020).
McMellen, A. et al. ATF6-mediated signaling contributes to PARP inhibitor resistance in ovarian cancer. Mol. Cancer Res. 21, 3–13 (2023).
Evans, A. M. et al. High resolution mass spectrometry improves data quantity and quality as compared to unit mass resolution mass spectrometry in high- throughput profiling metabolomics. Metabolomics 4, 132 (2014).
We thank M. Murphy, R. Zhang and R. Greenberg for critical reading of the revised manuscript; F. Vazquez for help with the CRISPR schematic; U. Chandran and J. Wang for help with bioinformatic analysis of the CRISPR screen; and Maureen Lyons for help with sequencing of the CRISPR library. A.U. acknowledges support from the Ovarian Cancer Research Alliance (MIG-2023-2-1018) and the HERA Foundation. R.B. acknowledges support from the National Institutes of Health (NIH) (P50CA272218) and the Melanoma Research Foundation. A.A. acknowledges support from the HERA Foundation. N.K.T. acknowledges support from the Congressional Directed Medical Research Fund (OC230324) and the HERA Foundation. A.R.C. acknowledges support from the NIH (T32GM133332). J.A.D. acknowledges support from the Hollings Cancer Center Abney Graduate Fellowship. E.M. acknowledges support from the NIH (T32HL091804). D.S.K. acknowledges support from the NIH (T32GM142606). A.C. acknowledges support from the NIH (T32HL091804). E.S.D. acknowledges support from the NIH (F31CA236372). F.M. acknowledges support from the NIH (R21CA267050), the Janet Burroughs Ovarian Cancer Foundation and the Congressional Directed Medical Research Fund (W81XWH2110338). N.H. acknowledges support from the NIH (R01CA242021). S.S. acknowledges support from the NIH (S10OD030286), the Hevolution Foundation (AFAR) and the Einstein-Mount Sinai Diabetes Center. D.T.L. acknowledges support from the NIH (R35GM119512). N.W.S. acknowledges support from the NIH (R35GM156596, R01CA259111 and R01CA298386). K.M.A. acknowledges support from the NIH (R37CA240625, R01CA259111, R01CA298386, P30CA010815 and P30CA047904), the Sandy Rollman Ovarian Cancer Foundation, the American Cancer Society (RSG-19-113-01-CCG), the Congressionally Directed Medical Research Program (HT9425-23-1-0436), the UPMC Hillman Cancer Center and the Wistar Institute. This project used the Hillman Animal Facility, the Cancer Genomics Facility, the Tissue and Research Pathology/Pitt Biospecimen Core, the Biostatistics Core and the Cancer Bioinformatics Services, which are supported in part by award P30CA047904.
Molecular and Cellular Oncogenesis Program, The Wistar Institute, Philadelphia, PA, USA
Apoorva Uboveja, Baixue Yang, Raquel Buj, Amandine Amalric, Aidan R. Cole, Miho Naruse & Katherine M. Aird
Department of Pharmacology & Chemical Biology and UPMC Hillman Cancer Center, University of Pittsburgh School of Medicine, Pittsburgh, PA, USA
Apoorva Uboveja, Baixue Yang, Raquel Buj, Amandine Amalric, Hui Wang, Naveen Kumar Tangudu, Aidan R. Cole, Richard S. Fang, Evan Levasseur, Miho Naruse, Zhentai Huang, Jeff Danielson & Katherine M. Aird
Aging + Cardiovascular Discovery Center, Department of Cardiovascular Sciences, Lewis Katz School of Medicine at Temple University, Philadelphia, PA, USA
Amandine Amalric, Emily Megill, Daniel S. Kantner, Adam Chatoff, Hafsah Ahmad, Mariola M. Marcinkiewicz, Andrea Andress Huacachino, Jennifer L. Pennise, Alison Jaccard & Nathaniel W. Snyder
Department of Biochemistry and Molecular Biology, Hollings Cancer Center, Medical University of South Carolina, Charleston, SC, USA
Department of Biochemistry, Albert Einstein College of Medicine, Bronx, NY, USA
Department of Radiation Oncology and UPMC Hillman Cancer Center, University of Pittsburgh School of Medicine, Pittsburgh, PA, USA
Department of Cellular & Molecular Physiology, Penn State College of Medicine, Hershey, PA, USA
Department of Pathology, University of Pittsburgh School of Medicine, Pittsburgh, PA, USA
Department of Cancer Biology, University of Pennsylvania, Philadelphia, PA, USA
Department of Obstetrics, Gynecology and Reproductive Sciences, University of Pittsburgh School of Medicine and Magee-Womens Research Institute, University of Pittsburgh, Pittsburgh, PA, USA
Department of Pathology, University of Colorado Anschutz Medical Campus, Aurora, CO, USA
Biostatistics Facility, UPMC Hillman Cancer Center, University of Pittsburgh, Pittsburgh, PA, USA
Department of Medicine, Division of Hematology/Oncology and UPMC Hillman Cancer Center, University of Pittsburgh School of Medicine, Pittsburgh, PA, USA
Department of Computational & Systems Biology, UPMC Hillman Cancer Center, University of Pittsburgh School of Medicine, Pittsburgh, PA, USA
Division of Reproductive Sciences, Department of Obstetrics and Gynecology, University of Colorado Anschutz Medical Campus, Aurora, CO, USA
A.U.: conceptualization, investigation, methodology, writing the original draft, visualization, writing, review and editing, and funding acquisition. B.Y.: investigation, visualization, writing, review and editing. R.B.: investigation, methodology, writing, review and editing. A.A.: investigation, methodology, writing, review and editing. H.W.: investigation. N.K.T.: investigation, writing, review and editing. A.R.C.: investigation, writing, review and editing. J.A.D.: investigation. R.S.F.: investigation. E.L.: investigation. M.N.: investigation, writing, review and editing. Z.H.: investigation and methodology. E.M.: investigation. D.S.K.: investigation. A.C.: investigation. H.A.: investigation. M.M.M.: investigation. S.G.: investigation. E.D.P.: investigation. A.A.H.: investigation. F.P.V.: methodology and investigation. J.D.: investigation. E.S.D.: investigation. J.L.P.: investigation. E.E.: resources. A.J.: investigation. L.B.: resources. M.D.P.: resources. K.C.: biostatistical analysis. F.M.: resources, supervision, writing, review and editing, and funding acquisition. N.H.: writing, review and editing. W.S.: investigation, methodology, writing, review and editing. C.J.B.: investigation, methodology, writing, review and editing. S.S.: investigation, methodology, writing, review and editing, and supervision. K.E.W.: conceptualization, writing, review and editing. B.G.B.: investigation, methodology, supervision, writing, review and editing. D.T.L.: investigation, methodology, writing, review and editing, and supervision. N.W.S.: conceptualization, investigation, methodology, writing the original draft, visualization, writing, review and editing, supervision and funding acquisition. K.M.A.: conceptualization, visualization, writing the original draft, writing, review and editing, supervision, project administration and funding acquisition.
Nature thanks the anonymous reviewers for their contribution to the peer review of this work. Peer reviewer reports are available.
Publisher’s note Springer Nature remains neutral with regard to jurisdictional claims in published maps and institutional affiliations.
(a) Propionylcarnitine abundance in cells treated with the IDH1 inhibitor (IDH1i) supplemented with αKG (n = 8 technical replicates representative from 3 independent experiments in each cell line pair). (b) Propionylcarnitine abundance in cells cultured in normal media or under glutamine starvation (GS) and supplemented with αKG (n = 8 technical replicates representative from 3 independent experiments in each cell line pair). (c-d) Same as (a-b), but the sum of all carnitines is shown (c: n = 8/group; d: FT282, n = 8 technical replicates representative from 3 independent experiments; Ovcar8, CCNE1, n = 8, CCNE1 + GS, n = 7, CCNE1 + GS + αKG, n = 8; technical replicates representative from 3 independent experiments). (e) Metabolite abundance data in all cell lines taken from DepMap. Pearson’s correlation. (f) l-carnitine abundance in FT282-MYC cells treated with the IDH1 inhibitor (left) or cultured under glutamine starvation (right) and supplemented with αKG (n = 8 technical replicates representative from 2 independent experiments). (g) HTML:TML ratio was assessed in FT282-CCNE1 cells treated with the IDH1 inhibitor and supplemented with αKG (n = 8 technical replicates representative from 2 independent experiments). All graphs represent mean ± SD. One-way ANOVA followed by Sidak’s multiple comparisons test.
(a) Cells with shTMLHE were incubated with 13C2-acetylcarnitine, and M + 2 acetyl-CoA was assessed (n = 8 technical replicates representative from 2 independent experiments). (b) Schematic of CrAT and CrOT activity in carnitine and acetylcarnitine production. Created in BioRender. https://BioRender.com/ct4zhsn. (c-d) Immunoblot of the indicated proteins in cells transduced with shRNAs targeting CrAT (c; shCrAT) or CrOT (d; shCrOT) and supplemented with αKG, l-carnitine (l-Carn), or O-acetyl-l-carnitine (Ac-Carn). (e) FT282-CCNE1 cells transduced with shRNA targeting CrAT, CrOT, or TMLHE (shTMLHE) were incubated with 13C6-glucose, and glucose-derived M + 2 acetyl-CoA was assessed (n = 8 technical replicates representative from 2 independent experiments). (f) Acetyl-CoA abundance was assessed in cells transduced with shRNA targeting TMLHE with or without supplementation with the indicated doses of acetate (n = 8 technical replicates representative from 2 independent experiments). (g-h) Same as (c-d), but cells were treated with olaparib (Olap) with or without supplementation with αKG, l-carnitine or O-acetyl-l-carnitine. % relative survival was normalized to vehicle controls (FT282-CCNE1: n = 4/group, Ovcar8-CCNE1, n = 3/group; technical replicates representative from 2 independent experiments). Graphs represent mean ± SD. One-way ANOVA followed by Sidak’s multiple comparisons test.
This file contains Supplementary Figs. 1–6 and Supplementary Tables 1 and 4.
Unprocessed blots for Fig. 3, Extended Data Figs. 1, 2 and 4–10 and Supplementary Fig. 5.
Anyone you share the following link with will be able to read this content:
Sorry, a shareable link is not currently available for this article.
Provided by the Springer Nature SharedIt content-sharing initiative
Original Source
This content was distilled for a focused reading experience. All rights belong to Nature.
Read original publication